
Raven Tools is a one-stop shop SEO tool. You can watch trends in traffic, view ad campaign metrics, and take notes all in the same spot. This versatile reporting tool is perfect for giving presentations and performing research without compiling data by hand.
We use Raven Tools for our monthly reporting with clients. It saves us time, helps us wade through all of the data, and makes the important data easily digestible. You can compare data month over month, year over year, or any which way that fits your fancy. We also use the SEO checker for our own internal reporting because it saves hours on accurate website reporting.
How to Use Raven Tools
1. Add a Website
Each website you analyze has its own “campaign” housed under a “profile” for better agency organizing. For example, you may have a profile for your AEC (architect, engineering, construction) clients, individual campaigns for each client, and a profile for your nonprofit clients, and their individual campaigns. Or, you may only have one campaign and a few profiles.
To add a new website, select a campaign at the top of the screen and click “Add New Campaign.” You can start as is or add additional platforms like Google Analytics or Facebook to gather data in one place.
2. Add Platform Data
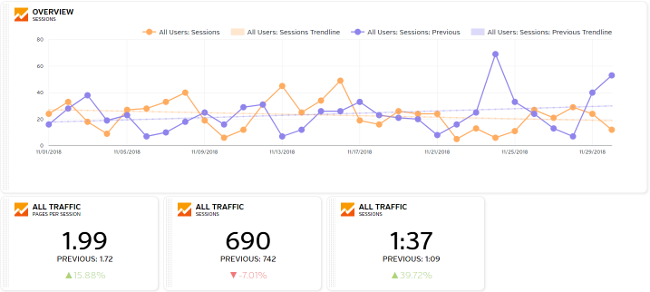
Raven Tools brings all of your website data to one spot, but only if you incorporate the data from all of your digital marketing platforms.
The main reason to add websites to your Raven Tools is to have all of your data in the same place. You can compare your cost per click between Google Ads and Facebook Ad campaigns, or give a report on the referral traffic from all of your social media at once, comparing it to direct traffic.
You can get the majority, if not all, of the data from the standalone platforms into one report with Raven Tools. Some data sources to add:
- Google Ads – watch how your campaign data has changed over time
- Facebook – track paid and organic efforts in separate sections
- YouTube – view subscriber trends and views over time
To add a source, go through the tabs in the left-hand menu and fill in your credentials for each relevant source.
3. Make a Report
These reports can be a great discussion topic for client meetings or to review on your own. You can set up separate reports for the same website e.g. using one to study changes from 5 years ago and another to review referral trends from the past month OR do both in the same report. It’s a great way to keep things organized by goal.
To start a report that pulls data from multiple sources analyzing one domain, click “New Report” in the upper right corner.
4. Set the Date
Don’t forget to check the date for your widgets! When you create a new chart or widget, it will use the last time frame you selected. To hone your research, you will need to scroll to the top of the section. There, click on the date range and pick a new one. Do you want to compare this month to last month, or to this time last year? Think of what things have changed that might have an impact on your metrics.
Hot tip: You need to change the date on each corresponding section – they’re not related to one another.
5. Add Images
Some analytics websites are not compatible with Raven Tools. For example, the website cannot pull data from SEMrush or Google Trends. If there is information you would like to include from outside sources, your best bet is to add it as a screenshot. You can also enhance your presentation with screenshots of successful ads, new page designs, and anything else you may want to draw attention to.
To add a screenshot, go to Add More Metrics > Text Summary and insert your picture into the textbox. You can include information above or below the screenshot for context.
6. Save and Recycle your Reports
We reuse reports rather than creating new ones each month – we clear out the data, follow a template, and update the dates as necessary. This allows us to adapt the reports month over month based on client requests and changes we see in the market. We always export our reports as PDFs and save them in our Google Drive folders before sending to the client.
Hot tip: We name the reports utilizing the client name, the reporting month, and reporting year.
Raven Tools is always adding new features and building compatibility with other platform metrics. Once you have the basics down, it will be easy to add new features to your reports.
Looking for something different? We recently discovered Deftly and fell in love with the UX.